Today I come bearing great news ! As of last weekend (April 22-24) I now have a whole of 10 data points taken within Canal Street
Canal drainage basin, at discharge point. As I mentioned in my previous
blog, Polluted Perception having
10 data points, 5 taken during an Ebb Tide and the other 5 taken during a Flood
Tide provides me with sufficient evidence of possible excessive (anthropogenic)
nutrient concentrations being released into the basin. Most importantly,
in my last blog I spoke about noticing for the first time some chemical
agents drifting in the canal basin more closely towards discharge point. Saturday
morning, April 23 called for a Flood tide at 9:27am. With this being said
Dr. Woodall and I not only found, what we expected, lagoon water
"flooding" into the culvert system, there was also clear, noticeable
water flowing outside of the culvert system as well. With a total of 1.40in. of rainfall this did not surprise us. This suggested all of the
water we were seeing, flowing out of the culvert system during flood
tide(carrying cigarette buds, chemical agents, sticks, leaves) must be all of
that rainwater runoff accumulating from the untreated CSC culvert system.
However, there was more needed to be done to be comfortable with this
conclusion. Ergo, during this sampling time, not only did I measure
salinity at sub surface (0.2 ppt;parts per thousand a measurement
in which salinity is measured,expressing concentrations of constituents within
the water.) salinity was also measured at ~1ft of the water column(33.3
ppt), showing a significant difference in measurements within the water column (between 0-1ft). This was huge ! I
wanted more data to determine the difference in water quality at discharge as
opposed to the water quality further East within the basin. I took a
sample ~100m East of the Canal (towards the IRL), within this area, salinity
measured the same as below surface at discharge (33.3 ppt) which makes sense.
So, in order to achieve nutrient concentrations, a water sample was also
taken at the East end of the basin. Below lies the results.....
Independent Research Projects Conducted by Undergraduate Researchers (UR) and Continuing Undergraduate Researchers (CUR) Enrolled in the Accelerated OCE1001, OCE2013 and OCE3014 Labs at Daytona State College
IMES
Monday, May 2, 2016
Emily UR - The results are in!
Well friends, it has been a moderately exciting journey, dancing for rain then analyzing water once it came. I realize now that the graph I posted last week was nothing short of a mess and rather hard to look at. I've decided to leave it where it is as an example of what NOT to do when making a graph. I apologize for any confusion, so this week I made two new graphs that represent the same data but more clearly. Note that there are no more -4,-5,-6 sites, instead I've used the original 3 site names for each and changed to a clustered bar graph to better show data from before and after the rain. Also, rather than using the Lower Halifax water quality criteria, I did some research and found the Florida Department of Environmental Protection (FDEP) water criteria for ponds which is better fitted for the water I'm working with.
Ahh, yes, much nicer to look at. Notice, I made the rainwater a gradient blue colored bar just because there is no before or after for the rain. My results took me by surprise when I found not only that the rainwater contained the highest nutrient measurements of all the water samples, with the exception of HPSMP-2 site which I'll touch on momentarily. Also some sites experienced a decrease in nutrients after the rain despite the amount present in the rainwater I collected, while others experienced an increase. I have to look into why this is.
Now, I still have to work with the NOAA HYSPLIT computer model to see where the storm that brought the rain had developed and traveled over. This will help me determine a source for all the nutrients found. I collected a second sample of rainwater for comparison and while it contained less nutrients than the first sample, it still contained more nutrients than those found in the ponds so I plan to make a trajectory model for that storm as well.
Looking again at HPSMP-2, one can see that after rain, both levels of Total Nitrogen and Phosphorus had increased, the nitrogen levels dramatically. This may not be due to surface runoff associated with the storm though, I'm inclined to believe the results were of anthropogenic origin. Found at the HPSMP-2 site after the rain was this:
Truly a shame, but the damage is done. I attempted to speak with the people whose house lies directly in front of this site but there has been no answer at the door.
Still to come are my HYSPLIT models which are to be generated soon and an update will be made this Friday when I conclude my project and reflect on it.
Thanks for tuning in!
Ahh, yes, much nicer to look at. Notice, I made the rainwater a gradient blue colored bar just because there is no before or after for the rain. My results took me by surprise when I found not only that the rainwater contained the highest nutrient measurements of all the water samples, with the exception of HPSMP-2 site which I'll touch on momentarily. Also some sites experienced a decrease in nutrients after the rain despite the amount present in the rainwater I collected, while others experienced an increase. I have to look into why this is.
Now, I still have to work with the NOAA HYSPLIT computer model to see where the storm that brought the rain had developed and traveled over. This will help me determine a source for all the nutrients found. I collected a second sample of rainwater for comparison and while it contained less nutrients than the first sample, it still contained more nutrients than those found in the ponds so I plan to make a trajectory model for that storm as well.
Looking again at HPSMP-2, one can see that after rain, both levels of Total Nitrogen and Phosphorus had increased, the nitrogen levels dramatically. This may not be due to surface runoff associated with the storm though, I'm inclined to believe the results were of anthropogenic origin. Found at the HPSMP-2 site after the rain was this:
![]() |
| Fertilizer bag extracted from HPSMP-2 site |
Still to come are my HYSPLIT models which are to be generated soon and an update will be made this Friday when I conclude my project and reflect on it.
Thanks for tuning in!
Dave, UR - Analysis continues...
| Array with 0-degree collectors, the night before the dive |
In order not to waste the opportunity to test in the water, we opted to strike overflow gutter of the pool with a metal hook, in order to produce recordings for analysis. I stood behind the target stand in each position that the speaker would have been, and rapped the overflow gutter ten times sequentially, to make sure that the recorded samples would have a reasonable degree of uniformity between iterations. While this constituted a major deviation from the original experiment design, we determined that it could still provide for a proof of concept, and possibly still give us an indication of collector performance.
![]() | |
| Carrying the target stand to the pool |
The Sparton PHOD-1 hydrophones were cabled with regular XLR microphone connectors and attached to digital audio recorders on loan from WDSC TV, and operated by DSC's own Jessie Guthrie. Thanks for the help Jessie! All three hydrophones worked without problems, and stayed fixed in the array throughout the duration of the dive.
![]() |
| Array with 25-degree collectors mounted |
Through these comparisons, I found out a lot more than I expected with all of the changes and pitfalls considered. First, the collectors did demonstrate an ability to enhance the collection quality of the hydrophones. Second, initial assessments show that an increase in collector volume could result in an increase in performance, so that is being assessed as a possibility for more testing over the summer. Moreover, it appears as though the 25 degree collectors performed optimally overall, so variance between shapes was demonstrated, satisfying the proof of concept. More analysis is being done presently, to show how all three hydrophones performed in concert. Results of this analysis will be discussed here before I present on Friday, so keep your eyes peeled.
![]() |
| Array with 90-degree collectors mounted |
The first question comes from Aleecia, who writes, "So my question: dolphins (i think) travel in groups. When dolphins make their sounds (clicks, whistles) can you see the specific dolphin making these sounds? In other words, I can make sounds without opening my mouth. If i was in a crowded room and made this sound, how are you going to be able to tell it's me and then relate that to any obvious behavior? So what does a dolphin look like when they make these sounds? Is it obvious enough to know which specific dolphin made it?"
Aleecia, I am going to answer all of those as one, and say that there is a bit of body language that can be associated with some of the more aggressive buzzes, but otherwise visual indicators are limited. Dolphins have their auditory projection tissue back at the base of their blowhole canal, and that sound gets pushed forward through their forehead, that biologists refer to as their melon. As Dr. Herzing pointed out in her last presentation (which I included the YouTube of in a previous post), dolphins also have the ability to use their melon to point their audible projection 20-degrees to the left or right, since turning their heads suddenly in the water carries more consequence than turning ours in the air. This further complicates the task of researchers, but hopefully this tool will help, when fully developed.
The second question comes from William, who writes, "I have read articles where architects and some engineers are now creating buildings and various structures based on shapes found in nature. Have you considered looking at the shape of the dolphin's 'dish' and using that as your shape?"
William, there is much wisdom in following the designs of thousands of years worth of evolution, but in this case, I am not even sure how I would go about approaching the idea from an engineering perspective. You see, dolphins lack an outer ear altogether, as it becomes problematic when constantly submerged, and even more problematic as depth increases. Instead of using an outer ear, dolphins use their lower mandible for general sound collection. The jawbone is filled with extra fatty tissue to help capture and transfer sound vibrations, which are then transferred to a cochlea at the back of the mandible. Just like our cochlea, the sound vibrations are then safely transferred to nerve ganglia which get interpreted by their brains. Once those vibrations hit the ganglia, that is where our understanding of their sound interpretation stops, meaning that we have absolutely no idea what things actually sound like to them, nor do we have firm comprehension of their brain function. It is for these reasons that I opted to start with something more traditional, though I will ponder the notion of emulating nature as I carry forward with my research. Great question!
![]() |
| Research presented at DSC's STEM Community Scholars Undergraduate Symposium, 29 APR 16 |
Thursday, April 28, 2016
Chris Browne, UR - IRP Wrap Up
![]() |
| E. coli (A fecal coliform) |
Alright, I have
done nearly all the research I’m going to do, and here is a wrap up of the
fecal coliforms found in our local waters. I will save just a few specifics and formal graphing for
the presentation. I have been clarifying the differences between safe water and
safe seafood. This data ranges a bit, and the biggest difference is that the
FDA will classify the fecal coliforms as CFU’s per grams of food specimen. So it’s
different then the water quality which is in CFU’s per m/L.
| New Smyrna Site |
I found it
interesting that this was the case, but in research and the amount of samples
typically took, I have found that water samples can range significantly. In
fact they can range so much so, that mostly all the studies that I found in
water quality were based on monthly averages. However, there are desired levels of fecal coliform info that I have discovered.
| Control-Tuscawilla-New Smyrna |
As stated last
week, 800 CFU’s per 100m/L is considered to be unsafe for recreation use. Well
ideal environment conditions (on monthly average) is considered to be <200
CFU’s per sample. Daily given samples should be no more than 400 CFU Studies
indicate that individual tests can range greatly, so the main difference that I
would improve on for a possible future experiment would be to test maybe every
few days and take a monthly average. The individual test would be strongly
effected by rain, tide, and current or normal conditions of any given natural environment.
~CB
Friday, April 22, 2016
Samantha, CUR- Polluted Perception
Happy Earth Day !
This afternoon I revisited Canal Street Canal to take some various water quality measurements at an outgoing (Ebb) tide. The Canal's oxygen levels were life sustainable measuring, 3.31mg/L. In fact I even noticed a few different species of fish swimming around within the Canal. Yet, visually, the water within the canal was unpleasant. My initial walk up to the Canal was shocking noting anthropogenic pollution instantly, with plastic bottles, snack wrappers, and an aluminum beer can which settled at the bottom.
In my opinion, the most significant material observed today was various amounts of chemical agents floating within the Canal. I have been monitoring this Canal for some time now, with a total of 8 data points. I do not recall ever noticing visual perception of chemical pollution. As I mentioned, I currently have 8 data points of various WQ parameters within this basin, my goal is to have 10, half of the information taken during ebb tides and the other half with flood tides. Tracking the tides is essential to my research, A flood tide "floods" the canal allowing water from the IRL to reach into the culvert system and mix with any fresh stormwater that may be within. Thus, an outgoing/ebb tide allows the mixing of the fresh and brackish(slightly salty waters;typically <30parts per thousand(ppt) as opposed to normal seawater being 35ppt) waters, leading the fresh stormwater into the canal drainage basin and most likely into the IRL. I will be out in the field all weekend (Sat. & Sun.) monitoring the water quality at Flood Tides. I'm hoping to achieve significant data allowing me to determine this culvert system is contaminated and therefore contaminating the water body of this Canal which leads into the IRL. Have a great weekend everyone !
This afternoon I revisited Canal Street Canal to take some various water quality measurements at an outgoing (Ebb) tide. The Canal's oxygen levels were life sustainable measuring, 3.31mg/L. In fact I even noticed a few different species of fish swimming around within the Canal. Yet, visually, the water within the canal was unpleasant. My initial walk up to the Canal was shocking noting anthropogenic pollution instantly, with plastic bottles, snack wrappers, and an aluminum beer can which settled at the bottom.
![]() |
| One of 3 plastic bottles observed in canal |
![]() |
| Chemical agents in Canal |
Emily UR - Crunching numbers
Happy Earth day fellow Earthlings! What an excited sort of progress my project has made. I created a graph that merged my results from nutrients found in my stormwater management ponds before a rain and the more recent results from nutrients found in my SMPs after a rain as well as data from rainwater that was collected during the storm! Now, at each pond I decided to take samples from three different areas in the pond to see if one area of the pond was more susceptible to nutrient pollution than another so at both the Halifax Plantation pond (HPSMP) and the Tuscawilla Park pond (TPSMP) the water analyzed before the storm are samples 1, 2 & 3 for three locations in one pond and these translate into 4, 5 & 6 after the storm but were taken from the same locations respectively. In the center of the graph dividing the two events is the nutrient readings I found in rainwater.
As you can see, there are some variances in the results, some sites experience a loss in nutrient concentrations while others experience results that require me to break the bar graph. Noting the nutrient criterion line for total phosphorus and identifying total phosphorus as the orange bars, we can see that all the readings for phosphate are either just at or above the nutrient criterion line. Now there are some plants in each pond so decreased nutrient readings could have something to do with the uptake of nutrients through plants following this storm. Let's look at the rainwater for a minute though. The nutrient concentrations found in rainwater were greater than every site with the exception of HPSMP-5 which I'll talk about in a minute. According to my chemical spreadsheet, there are many possible sources of nitrate and phosphates in our atmosphere, including the burning of fossil fuels for nitrate and soil dust or seawater for phosphate. I'll definitely have to examine the rainwater results more closely in the coming week as I see another storm is coming over the Gulf so I hope to be able to get more data for comparison.
Now, I want my audience to better understand the view of the lake that supports my hypothesis of one site being more susceptible to nutrient pollution than another. Below are pictures of the Halifax Plantation pond.
As you can see, there are some variances in the results, some sites experience a loss in nutrient concentrations while others experience results that require me to break the bar graph. Noting the nutrient criterion line for total phosphorus and identifying total phosphorus as the orange bars, we can see that all the readings for phosphate are either just at or above the nutrient criterion line. Now there are some plants in each pond so decreased nutrient readings could have something to do with the uptake of nutrients through plants following this storm. Let's look at the rainwater for a minute though. The nutrient concentrations found in rainwater were greater than every site with the exception of HPSMP-5 which I'll talk about in a minute. According to my chemical spreadsheet, there are many possible sources of nitrate and phosphates in our atmosphere, including the burning of fossil fuels for nitrate and soil dust or seawater for phosphate. I'll definitely have to examine the rainwater results more closely in the coming week as I see another storm is coming over the Gulf so I hope to be able to get more data for comparison.
Now, I want my audience to better understand the view of the lake that supports my hypothesis of one site being more susceptible to nutrient pollution than another. Below are pictures of the Halifax Plantation pond.
![]() |
| A view of the entire pond at Halifax Plantation |
![]() |
| View of Site 1 & 4 |
![]() |
| View of Site 2 & 5 |
| ||
| View of Site 3 & 6 |
| If you compare the data found with pictures of the quality of water at each site, you can see that the results found at site 2/5 are likely not an error. Further investigation is required as I look to determine the source of this as well as collect more rain and water from a coming storm to expand my data library. |
Thursday, April 21, 2016
Chris Browne, UR - Unfit for Recreation
| Unfit for Recreation - Canal Street |
A: My results showed no specific E. coli, yet, I have confirmed that the bacteria counted was fecal coliforms, that are specifically from gut tracks, lactose or animal protein break downers.
Q: Phaleisa
Section01
I have seen people fishing on Reed canal and Tuscawilla, my question is that are their any signs poster to let the public know that the canal/pond is contaminated, and is the fish safe for human consumption?
A: Tuscawilla may end up being within a decent range of acceptable bacteria, I am getting more specific data on that soon. However, there seems to be an abundance of nutrients, which can be a sign of pending problems to come. Look to Emily Reyes for more info on Tuscawilla Park as well. Check back next week for more info on wildlife/bacteria levels.
| The Lab at IMES, DSC |
Technically I had TNTC results. So, as directed by Dr. Horikami, I broke down the filter into quarters and attempted to get specific readings. All results will post as a greater then number for that reason. Plus this is the way the EPA delivers results. Samples were based on 100mL, the same volume of sample that computed evenly into the formula, supplying us with the actual number of CFUs(Colony Forming Units).
The Environmental Protection Agency (EPA) states that anything over >800 CFUs, is considered to be unsuitable for recreational use. These are my findings, while next week I'll focus on what they mean for the fishing and shell fishing of the area. A reminder that fecal coliforms are a present and natural occurrence in the environment.
UNFIT: >800 CFUs, per 100mL
Canal Street: >1,125 CFUs , per 100mL
Tuscawilla Park: >260 CFUs, per 100mL.
Renee; UR: What you've all been waiting for!
MATH! ...Yay?
So who is ready for some statistics?
| Results of pH T-test. In a nutshell this decimal means that there is a 95% chance that both samples came from the same place. |
Unfortunately, if I understood the T-test correctly, both the pH and the redox T-tests showed that the two groups in question (the root zone and contrast samples) were not significantly different from one another.
| Results of redox T-test. In a nutshell this decimal means that there is a 88% chance that both samples came from the same place. |
Hopefully there will be more significant differences in one of the tests UF will be performing. We have at least finally gotten the samples shipped off. Once again thanks to Dr. Woodall who is the best, most amazing professor ever!
Q: Michael Blevins, former geology student
I'm surprised to see that according to your map, much of Florida has acidic soils. I know when in the geology class, we learned that much of Florida's soils were a sort of sandy soil with a lot of calcium carbonate in them--which you would think would be more alkaline. Can you explain these differences? Thanks!
A: The University of Florida IFAS Extension a great explanation in one of their documents concerning "soil pH and the home landscape": "The median soil pH for Florida soils is 6.1, which is characterized as slightly acidic. However, Florida soils can vary widely in pH, depending on the parent material(Source from which the Soil came, ie. eroded granite, shell deposits, organic litter, ect...) from which the soil formed or on the management of the soil. For example, soils formed under pine flatwoods can be quiet acidic. In contrast, soils formed from calcium carbonate-bearing materials like limestone, marl, or seashells are alkaline. Alkaline conditions are common in coastal soils and the mineral soils of south Florida. It is also common to encounter alkaline soils in the home landscape as a result of calcium carbonate-rich building materials (i.e., concrete, stucco, etc.) that may be left in the soil following construction."
The full document can be found HERE.
In the specific case of my Sarracenia minor(pitcher plants) they live in a bog
full of sphagnum moss and other organic material right in the middle of pine flatwoods. It is this large amount of decaying organic matter that makes the soil more acidic for the pitchers who love the acid.
Wednesday, April 20, 2016
Samantha, CUR- Industrial Stormwater Monitoring
Greetings, since my last blog, I have been looking deeper into Aleeica's question, Have you ever thought about taking some water samples somewhere within the watershed, to see what's in it before it gets to the canal? Fortunately, I recently stumbled upon an article from Washington State's, Department of Ecology, focusing on monitoring the water quality (WQ) from a pipe (or culvert system) discharging stormwater offsite, as well as monitoring WQ within ditches and man holes, carrying stormwater. Environmental Protection Agency (EPA) suggests; "when taking a sample within a storm drain or man hole, to use a pole with a sampling container attatched at the end to collet the sample."
This concoction can easily be made in the field ! It is not always possible to sample stormwater runoff in locations such as ditches or pipes where the flow is concentrated, thus sampling a sheet flow allows you to gather stormwater runoff before being concentrated. A sheet flow sample must be taken during or immediately after a storm, choosing significant, downhill areas where urban stormwater runoff is collecting, allowing an accumulation of runoff. Monitoring the WQ specifically within storm drains, if possible, will allow quantitive data to determine pollutant concentrations associated with runoff before the stormwater reaches the receiving water. Canal Street Canal (CSC) consists of an array of interconnected swales and ditches as well as direct piping that feed into the Canal.
When going out in the field this upcoming weekend, not only will I be monitoring the water quality, I will take initiative in setting up methods for collecting this storm water from a site other than the Canal Street Canal drainage basin, the only thought/problem that comes to mind is, "Will my Nalgene bottles be able to fit through the small opening within the storm drains?" Stay tuned !
Bibliography:
![]() |
| Attach a bottle for sampling in manholes or storm drains. A boathook is used in this example with a bottle attached using a filament string from Washington's Ecology Dept. |
![]() |
| Field Scientist performing sheet flow sampling. |
Bibliography:
- Jenkins, D., C. Cairns, and N. Barber. "How Do Ward Pharmacists Spend Their Time?: An Activity Sampling Study." International Journal of Pharmacy Practice 1.3 (1992): 148-51. How to Do Stormwater Sampling. Department of Ecology, Mar. 2010. Web. 20 Apr. 2016. <https://fortress.wa.gov/ecy/publications/publications/0210071.pdf>.
- Us Epa, Ow, Owm, Water Permits Division, Municipal Branch. Industrial Stormwater Monitoring and Sampling Guide (n.d.): n. pag. Industrial Stormwater Monitoring. Environmental Protection Agency, Apr. 2009. Web. 20 Apr. 2016. <https://www3.epa.gov/npdes/pubs/msgp_monitoring_guide.pdf>.
Monday, April 18, 2016
Emily UR - Phases Two & Three are Underway!
![]() |
| Rain over Florida, 4/14/2016 8pm |
I'd like to revisit Aleecia's Question from last week which may have been answered inappropriately.
The Question:"Why are your total phosphate concentrations so different for the one pond?"
Refer to my blog from last week for the graph she is referring to. I answered this question assuming Aleecia was referring to the different levels between the two ponds instead of what she actually meant, which is why the levels of phosphate are so varying in the one Tuscawilla Park pond. The answer to this has to do with where in the pond I collected the water. Throughout each pond the water quality varies slightly either because of vegetation or interaction with a lower quality water body. In Tuscawilla Park, I collected water from three different areas of the pond; the first was collected at a culvert connecting the pond I'm studying to a neighboring pond that is experiencing a severe algae bloom. The second sample was collected next to a concrete bridge that leads to a small island in the center of the pond and the third sample was collected at another culvert that connects my pond to a drainage basin. As pictured, you can see there are slight differences in the turbidity of the water. Collecting water from various locations along the pond allows me to possibly narrow down a source of nutrients. Hopefully, I've better answered your question this week!
Sunday, April 17, 2016
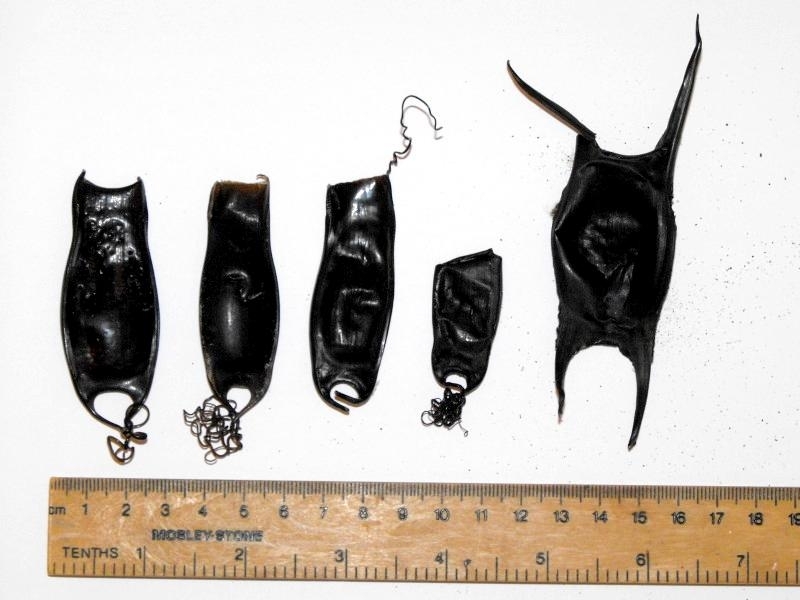
Rachel UR - Time For An Egg Hunt!
![]() |
| Examples of egg cases. The case to farthest on the right is from the Common skate |
Materials:
- A stranded ruler
- Waterproof Container with freshwater (I will be using a 5 gallon bucket)
- 1 gallon plastic zip lock bag
- Field notebook and Pencil
- Camera
Method:
- Before leaving for your search site, fill your waterproof container with freshwater. This container can either be carried with you or left in your car.
- Once you find an egg case record your environmental conditions and location
- Take a picture of the case before collecting it either into your waterproof container or zip lock bag.
- Put the egg case into the waterproof container with freshwater and let soak for 1-2 hours so they can regain their full shape. (Some larger cases may need to soak for up to 24 hours)
- Take the egg case out of the bucket and record length of the body, length from horn to horn, and width of the body
- Identify the species belonging to the egg and record
- Set the egg out in the sun for preservation
In my research I ran a cross a website called sharktrust.org and planned to use the ID key that hey had to identify my egg cases. Upon looking further I found that they ID key was for the skate of Great Britain which isn't very useful for me. I am currently looking for another ID key that I can use but I might have to make my own. Happy hunting everyone!
Friday, April 15, 2016
Deanna DeLong UR- Perseverance and patience!
| The transition from the Matanzas River to the Halifax River |
Thank you, Jacob, for your question. I have been fishing the North end of Volusia (specifically in and near the Tomoka Basin), and in different areas of Flagler County. Both areas are pretty similar environments, so I don't think the water environments alone are enough to effect the number of fish I catch. I have been fishing in salt marshes, which are visibly very similar in both counties. In fact, the water bodies that I fish for red drum in Flagler county are connected to or in the Matanzas River which then turns into the Halifax River. Great question!
![]() |
| Red Drum |
Victoria Czupta UR- Let's go fishing
So a day has been set to get some shark fishing accomplished. The fishers are at their marks, ready to catch what's out there and win with the biggest catch! And the bell starts the tournament! There are people everywhere trying to catch the biggest shark and prove they are the best fisher!
There are many tournaments that are set up to actually catch and kill sharks, with the winner getting a grand prize at the end. Many people fish in these tournaments to just kill the animals that scare them, while some fish them just for the sport of it. But why kill these animals if they aren't even going to be eaten like a regular fish. We know all animals are important, but why is it allowed to just kill something that many people don't like? This is a big reason that many people today are working on shark research.
I personally will be catching these sharks and releasing them to get an idea at to how many sharks live in the local waters and find the characteristics that define them. Learning this can help determine how important a certain fish species can be or a particular environment can be, especially when it comes to mating and nursing.
It was been determined that catching sharks first thing in the morning will be best, along with an ebb tide, as it is going out instead of coming in. This is the same idea as fishing for any other fish, where they don't like the heat during mid-day, and with the tide going out, many fish will be leaving the inlet and going out to the ocean for deeper water, where the sharks will be waiting.
I am still determining a few details as the exact type of leaders, which I have been given tips on. But most everything else is now set up to head out. My identification sheet is still being worked on, since it right now is 40 pages, but it is easily understood when trying to figure out what kind of shark was caught. This leads me into a question that was asked:
Jacob sec. 65 asked It looks like there are some stingrays on that key of yours. Why is that? What do they have to do with sharks?
Well, sharks are called cartilaginous fish which are in a taxonomic class called Condrichthyes. Rays are also in this class, since neither have actually bones aside from their teeth. Their bodies are made of cartilage, just like the ears and nose of humans. After the class is a sub-class, which seperates animals called chimeras (Holocephali) from the sharks and rays known as Elasmobranchii. From there, sharks and rays and skates are seperated. But they do have a lot of similar features aside from having no bones. In most of the Elasmobranchii, they have an organ called Ampullae of Lorenzini, which are the pores on the underside of the nose which have a gel inside. Just like with an ultrasound, this gel absorbs electrical waves that are given off by all living organisms, and the pores send the waves to the brain. This is what allows most sharks, rays, and skates to hunt for their food and avoid anything that may cause them harm. This is also the reason that for a long time people said to punch a shark in the nose and it will flee, because it disrupts their ability to sense their environment.
To Angela Boney: The shark researcher is working at the Kennedy Space Center for the KSC Ecological Program & Integrated Mission Support Services
![]() |
| A thresher shark caught in a New Jersey Shark Fishing Tournament |
There are many tournaments that are set up to actually catch and kill sharks, with the winner getting a grand prize at the end. Many people fish in these tournaments to just kill the animals that scare them, while some fish them just for the sport of it. But why kill these animals if they aren't even going to be eaten like a regular fish. We know all animals are important, but why is it allowed to just kill something that many people don't like? This is a big reason that many people today are working on shark research.
I personally will be catching these sharks and releasing them to get an idea at to how many sharks live in the local waters and find the characteristics that define them. Learning this can help determine how important a certain fish species can be or a particular environment can be, especially when it comes to mating and nursing.
It was been determined that catching sharks first thing in the morning will be best, along with an ebb tide, as it is going out instead of coming in. This is the same idea as fishing for any other fish, where they don't like the heat during mid-day, and with the tide going out, many fish will be leaving the inlet and going out to the ocean for deeper water, where the sharks will be waiting.
I am still determining a few details as the exact type of leaders, which I have been given tips on. But most everything else is now set up to head out. My identification sheet is still being worked on, since it right now is 40 pages, but it is easily understood when trying to figure out what kind of shark was caught. This leads me into a question that was asked:
Jacob sec. 65 asked It looks like there are some stingrays on that key of yours. Why is that? What do they have to do with sharks?
![]() |
| Eagle ray, with Ampullae of Lorenzini under it's nose. |
![]() |
| Ampullae of Lorenzini on the underside of a Tiger sharks nose |
To Angela Boney: The shark researcher is working at the Kennedy Space Center for the KSC Ecological Program & Integrated Mission Support Services
Renee; UR: Lets talk acid! ...Soil acidity that is...
I know that last week I mentioned such things as graphs being blogged about this week; however, I thought that the wonderful question that I received concerning soil pH deserved a thorough answer.
... it was also a very busy week and I hate to admit but sieving my samples to send to UF was all I was able to get done So far as project based work is concerned.
Q. Jacob sec. 65.
why are you soils so acidic? That seems really low to me like nothing should be able to live there. Are Florida soils typically this acidic?
A: I love this question! The diversity of kingdom Plantae is one of the things that has captivated me about plants and is well illustrated in how plants have adapted to live in pretty much every sort of soil on earth.
A huge contributor to the acidic soil in the south is the decay of organic material which produces hydrogen ions which in turn lower soil pH. This is very true at my site which has been thick with pine trees which continually shed and renew their needles for over a century. The sphagnum moss which grows thickly in the wetland soil also contributes to the high amount of decaying organic mater at my site location.
For a more in depth but easily understood explanation of acidic soil causes check out Jeff Ball's article on The Samuel Roberts Noble Foundation website. The article is about both soil acidity and "correcting" it with lime. If the acidity explanation was not so good I wouldn't recommend it... Please note that I do NOT condone liming(the practice of adding lime to soil to raise the pH for the purpose of growing plants that do not tolerate acidic soils particularly grass and food)
Here in Florida where a lot of our native flora (plants) prefer our naturally acidic soil the habits of various farmers and home owners working hard to change the soil to fit their needs have put added stress on our native friends. Which is totally not cool.
... it was also a very busy week and I hate to admit but sieving my samples to send to UF was all I was able to get done So far as project based work is concerned.
Q. Jacob sec. 65.
why are you soils so acidic? That seems really low to me like nothing should be able to live there. Are Florida soils typically this acidic?
A: I love this question! The diversity of kingdom Plantae is one of the things that has captivated me about plants and is well illustrated in how plants have adapted to live in pretty much every sort of soil on earth.
A huge contributor to the acidic soil in the south is the decay of organic material which produces hydrogen ions which in turn lower soil pH. This is very true at my site which has been thick with pine trees which continually shed and renew their needles for over a century. The sphagnum moss which grows thickly in the wetland soil also contributes to the high amount of decaying organic mater at my site location.
For a more in depth but easily understood explanation of acidic soil causes check out Jeff Ball's article on The Samuel Roberts Noble Foundation website. The article is about both soil acidity and "correcting" it with lime. If the acidity explanation was not so good I wouldn't recommend it... Please note that I do NOT condone liming(the practice of adding lime to soil to raise the pH for the purpose of growing plants that do not tolerate acidic soils particularly grass and food)
Here in Florida where a lot of our native flora (plants) prefer our naturally acidic soil the habits of various farmers and home owners working hard to change the soil to fit their needs have put added stress on our native friends. Which is totally not cool.
Moving on, Sarracenia minor(hooded pitcher plant) is recommended to be potted in a sphagnum moss and perlite mix of between 5.0pH and 3.0pH by Plant Delights nursery who have some of the best exotic plant overviews I've ever seen on the web. As we saw last week in my blog the acidity hovered in the 3pH block dropping as low as 2.87 making this rather acidic.
Keep in mind that the 5-3pH recommended by the nursery is for potted plants. Natural soils are effected by a wider range of pH changing factors so such as leeching. Also projected preference zones are subjective to some degree. Plants like all life are often surprising and will persevere in conditions outside preference parameters.
Now for a fun, fascinating and thought provoking cluster of facts:
The hooded pitcher plant is not the only plant whole likes acidic soils. The long leaf pines for which the preserve where my site is located was named also love the acidic conditions.
| The magical hydrangea! The colors are NOT different varieties but different pHs! |
Other plants get complicated with their soil pH. The hydrangea is a fantastic example! Their preferences are broad: any pH between 4 and 7 makes for very happy hydrangeas; however, the owner may prefer hydrangeas in acidic soil which produce blue flowers while the neighbors may prefer pretty pink flowers grown in basic soil.
I personally prefer the lovely shades of purple in the 5/6pH area.
Before I head to bed I'd like to issue a thought challenge:
All of you clever Oceanography and Aquatics students out there who have grass google the pH preference of your grass variety. Write that down. Now considering the soil map above and the pH guidelines from Plant Delights for pitcher plants think about two questions:
How natural might the soil beneath your grass be? Why do you think this?
And based on the pH criteria alone could pitcher plant grow successfully in your yard? Again, why?
Thursday, April 14, 2016
Chris Browne, UR - Fecal Growth
| Canal Street in the Field |
| Samples: Control, Tuscawilla Park, Canal Street |
No need to show the close up of the negative control, there was close up no bacteria what so ever, which was mostly expected. The first two pictures are for fluff, and show that I used the desired methods for sample retrieval, as well as show my assistance from Dr. Horikami.
| Tuscawilla Park Fecal Coliforms |
![]() |
| Science Department Head, Dr. Horikami |
| Canal Street Fecal Coliforms |
~CB
Saturday, April 9, 2016
Emily UR - About a week of intermission..
I need to work on my rain dance if I want to start seeing some progress in my study. Phase One is complete but waiting on a rainstorm is taking much longer than I had originally anticipated. Comically, even if there is a perfect storm for sample collecting in the coming week, I will be in Fort Pierce completing my internship with the Smithsonian Marine Research Station (so excited!) and will therefore be unable to further my study until I return on Friday evening. Hopefully my classmate Chris will have some results from his sampling of the same Tuscawilla Park stormwater management pond (SMP)!
Questions from Aleecia Sec. 65: "Why are your total phosphate concentrations so different for the one pond?"
Thank you for the question Aleecia! The question refers to the graph to the right for those who may have missed my blog from last week. I wish I could give you a more thorough answer as to specifically why there are higher concentrations of phosphorus in the Tuscawilla Park SMP compared to the Halifax Plantation SMP but for now, all I have are hypothetical sources. Phosphorus has many natural and anthropogenic, or human-caused, sources as a pollutant. A likely natural source for phosphorus pollution in this case would be atmospheric deposition as soil dust that gets blown into the upper atmosphere acts as a condensation nuclei for rainwater to condense on and will enter a water body via precipitation. Anthropogenic sources are more likely the cause here and some of those sources include fertilizers and domestic and industrial wastes. Fertilizers aren't used at Tuscawilla Park so that leaves domestic waste as a likely cause for the levels of phosphorus at the one park. Considering Tuscawilla has also been experiencing sewage management issues, domestic waste is not an unlikely source. I hope this answered your question!
Questions from Aleecia Sec. 65: "Why are your total phosphate concentrations so different for the one pond?"
Thank you for the question Aleecia! The question refers to the graph to the right for those who may have missed my blog from last week. I wish I could give you a more thorough answer as to specifically why there are higher concentrations of phosphorus in the Tuscawilla Park SMP compared to the Halifax Plantation SMP but for now, all I have are hypothetical sources. Phosphorus has many natural and anthropogenic, or human-caused, sources as a pollutant. A likely natural source for phosphorus pollution in this case would be atmospheric deposition as soil dust that gets blown into the upper atmosphere acts as a condensation nuclei for rainwater to condense on and will enter a water body via precipitation. Anthropogenic sources are more likely the cause here and some of those sources include fertilizers and domestic and industrial wastes. Fertilizers aren't used at Tuscawilla Park so that leaves domestic waste as a likely cause for the levels of phosphorus at the one park. Considering Tuscawilla has also been experiencing sewage management issues, domestic waste is not an unlikely source. I hope this answered your question!
Subscribe to:
Posts (Atom)